1.86x Median ROAS: Meta Ads Ecommerce Benchmarks for Marketers
The median ecommerce Meta Ads account in 2026 runs a CPM near $15, a CTR around 2.19%, a CVR near 1.5%, and a CPA close to $38.99. Blended ROAS across ecommerce lands under 2x more often than most sellers assume. None of that tells you whether your account is healthy until you run it against your own margin and break-even math, which is where the real diagnosis starts.
TL;DR:
- Average ecommerce ad costs in 2026 include a CPM around $15 and a CTR near 2.19%, but profits depend heavily on your margin and break-even ROAS.
- Vertical differences significantly affect benchmarks, with beauty and pet brands often more forgiving due to repeat purchases, while electronics are costlier to advertise.
- Campaign placement and objective influence key metrics, with Reels and prospecting campaigns typically yielding lower CTR and CVR, so segment data accordingly.
- A ROAS below 2x usually warrants investigation, especially to distinguish between existing customer revenue and new customer acquisition performance.
- Fix measurement issues first, then creative, before adjusting bids, and always compare your metrics against your own margin structure rather than industry averages.
Table of Contents
- What Are the Overall Meta Ads Benchmarks for Ecommerce?
- How Do Meta Ads Benchmarks Vary by Ecommerce Vertical?
- How Do Placement and Campaign Objective Change Benchmarks?
- What Does Each Metric Signal When It Moves?
- Why Doesn’t Ads Manager ROAS Always Match Your Real Revenue?
- Does Advantage+ Outperform Manual Campaign Structures?
- How Do You Turn These Benchmarks Into Action?
- Where Do These Ecommerce Benchmark Numbers Come From?
- How I Use These Benchmarks With Ecommerce Clients
- Want Help Applying These Benchmarks to Your Account?
- Sources
- FAQ
What Are the Overall Meta Ads Benchmarks for Ecommerce?
Every benchmark conversation starts with the same six metrics, and most marketers misread at least two of them. Here’s what the current medians actually look like, and what each one is quietly telling you.
Across a dataset covering more than 40,000 brands from August 2025 through July 2026, Triple Whale puts overall CPA at $38.99 and CPM at $15.06, with CVR sitting at 1.53%. Flighted’s parallel 2026 report lands close by, with median CTR at 2.19%, CPC ranging roughly $0.70 to $1.38, and median CPA at $38.17. When two independent datasets converge this tightly, treat the overlap as your realistic floor for comparison, not an aspirational target.
Here’s what each metric measures and the default window most of these reports use, which matters because a 7-day click attribution window will always show a rosier CPA than a 1-day click window on the same account:
- CPM (cost per 1,000 impressions): what you pay for reach before anyone clicks. Median sits near $15, though Skale Strategy’s ecommerce-specific data puts it closer to $13.48, reflecting differences in account mix and season.
- CTR (link click-through rate): the percentage of impressions that turn into a click on your link, not a reaction or comment. Ecommerce median runs about 2.19%.
- CVR (post-click conversion rate): the share of link clicks that convert to a purchase, typically tracked on a 7-day click window. Ecommerce median hovers near 1.5% to 1.57%.
- CPA (cost per acquisition): total spend divided by purchases. Median around $38 to $39, but this number is meaningless without your AOV next to it.
- ROAS (return on ad spend): revenue divided by spend, as reported inside Ads Manager. Skale’s blended ecommerce median comes in around 1.86x, well below the 4x figure many founders assume is standard.
- AOV / MER (average order value / marketing efficiency ratio): AOV varies enormously by vertical, and MER (total revenue divided by total ad spend, storewide) is often a more honest health check than platform ROAS alone.
The diagnostic value here is in the gaps, not the averages. A CPM of $15 with a CTR of 1% tells a different story than a CPM of $15 with a CTR of 3%. In the first case, your creative isn’t earning attention at that price. In the second, your creative works and your bottleneck is somewhere downstream, likely on the landing page or in your offer.
One pattern worth flagging: Flighted’s report highlights CPM inflation as one of the biggest cost pressures ecommerce advertisers face this year, driven by rising competition for the same inventory. That means a rising CPM on a stable account isn’t automatically a red flag. It might just be the market. The question is whether your CTR and CVR are absorbing that cost increase or amplifying it.
Median ROAS sitting under 2x also deserves a second look before anyone panics. A 1.86x ROAS on a product with 60% contribution margin is profitable. The same 1.86x on a product with 20% margin is a slow bleed. The number only becomes useful once you attach your own cost structure to it, which is exactly what the break-even section further down walks through.
How Do Meta Ads Benchmarks Vary by Ecommerce Vertical?
Blended medians hide more than they reveal. A beauty brand and an electronics retailer selling through the same platform, with the same objective, will post wildly different numbers, and neither is doing anything wrong.
Apparel and beauty tend to run cheaper, higher-frequency benchmarks because they compete on emotional, visual creative in a crowded but affordable auction. Electronics and home goods carry higher AOV but also higher purchase friction, since buyers research longer before committing, which drags CVR down and CPA up. Food and beverage sits in the middle, often propped up by subscription models that improve lifetime economics even when first-order ROAS looks unimpressive. Pet products benefit from high repeat-purchase behavior, which softens the blow of a mediocre CPA.
These ranges are built around the blended medians reported by Triple Whale and Skale Strategy, interpreted against typical category cost structures. Treat them as a directional band, not a precise scorecard.
A few patterns stand out once you compare verticals side by side:
- Beauty and pets tend to be the most forgiving categories because repeat purchase rates and impulse buying compress the distance between click and conversion.
- Electronics is consistently the costliest vertical to run, not because the creative is weaker but because the buying decision takes longer and often happens across multiple sessions and devices.
- Apparel sits in a strange middle ground: cheap to reach and click on, but return rates and sizing friction quietly erode the ROAS number that Ads Manager reports.
- Food and beverage numbers look average on paper but often understate true lifetime value if the brand runs subscriptions, since a first-order CPA of $40 can be a bargain against a $400 customer lifetime value.
Before you benchmark your own account against any of this, confirm you’re comparing the right vertical baseline. A supplement brand should not be judging itself against apparel medians just because both sell direct to consumer. Match your product’s price point, purchase frequency, and consideration cycle to the closest vertical above, and use that as your working target instead of the blended overall median.
How Do Placement and Campaign Objective Change Benchmarks?
A benchmark without a placement and objective attached is close to useless.
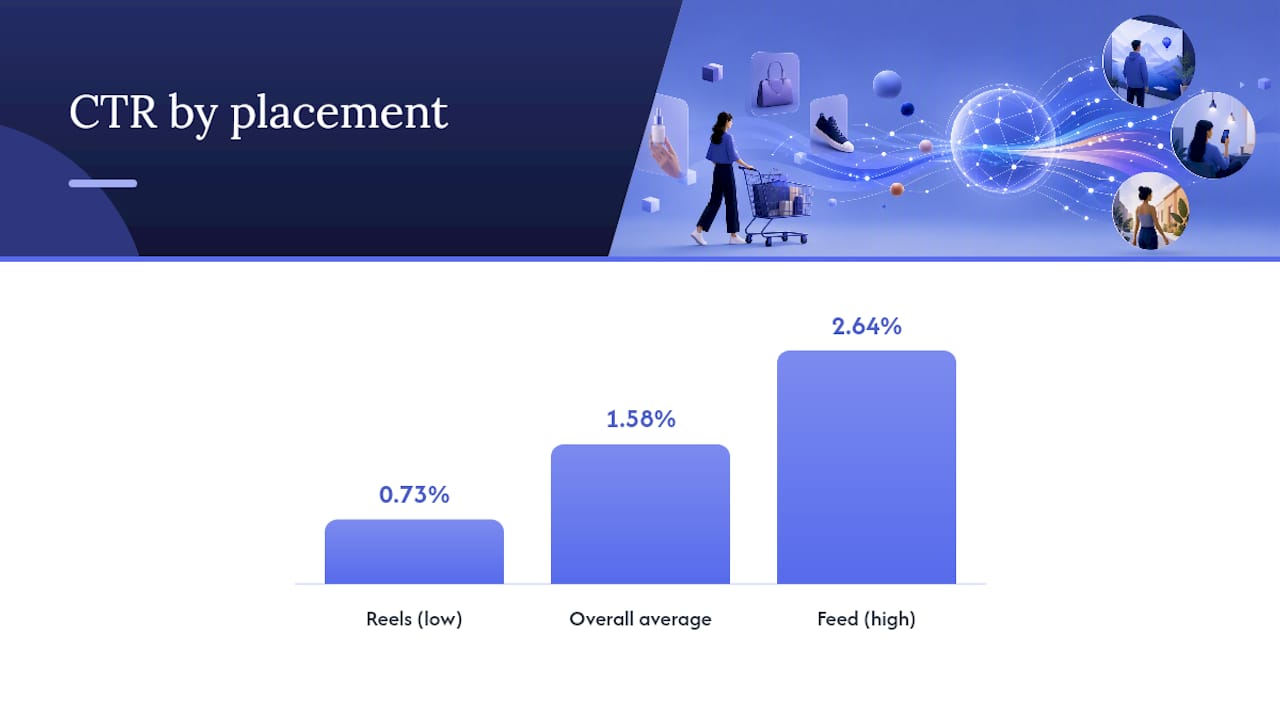
Focus Digital’s 2026 CTR report puts the overall average CTR across industries and placements at 1.58%, with a spread ranging from 0.73% to 2.64% depending on where and how the ad runs. Reels consistently pulls lower link CTR than Feed, largely because Reels is a passive, entertainment-first environment. People are watching, not shopping, so the click intent simply isn’t there in the same way.
Objective matters just as much as placement. Prospecting campaigns, aimed at people who’ve never heard of your brand, will always show weaker CTR and CVR than retargeting campaigns aimed at warm traffic that already added to cart or viewed a product page. Catalog and Advantage+ shopping campaigns blend both audiences automatically, which makes their raw numbers hard to compare against a manually segmented account.
A few rules keep this from turning into a false-alarm generator:
- Never compare a Reels placement report against a Feed benchmark. Segment reporting by placement before drawing any conclusion about creative performance.
- Expect prospecting CPA to run meaningfully higher than retargeting CPA. That gap is normal, not a sign that top-of-funnel targeting is broken.
- Treat catalog and Advantage+ shopping numbers as a blended average of cold and warm traffic, and don’t hold them to the same CTR standard as a pure prospecting campaign.
- Pull placement and objective breakdowns before every benchmark comparison. Skipping this step is the single most common reason marketers panic over numbers that are actually fine.
What Does Each Metric Signal When It Moves?
Every metric on your dashboard is a diagnostic, not just a scoreboard. The trick is knowing which lever to pull when a number drifts.
- CTR below your vertical’s range usually points to creative fatigue, a weak hook, or an audience that’s drifted stale. Test a new opening frame in the first three seconds of video creative, swap static images for UGC-style content, or narrow the audience back toward high-intent signals.
- CVR lagging behind benchmark rarely means the traffic is bad. Audit page load speed, checkout friction, and whether your pixel or Conversions API is actually firing correctly before touching the ad account at all.
- CPM climbing without a CTR change often signals audience saturation or a seasonal bid spike, not a broken account. Check frequency first. If frequency is climbing alongside CPM, you’ve likely oversaturated your audience and need fresh creative or a wider pool.
- CPA rising while ROAS holds steady can simply mean AOV increased, which is a good problem. Always look at CPA and ROAS together, never in isolation.
- Blended ROAS looking strong while new-customer ROAS looks weak is the most common self-deception in ecommerce accounts. Blended ROAS includes existing customers who were always going to buy again. New-customer ROAS isolates whether your acquisition engine is actually working.
That last point deserves more weight than most dashboards give it. Guidance from PPCBatman frames a healthy ecommerce ROAS as typically falling somewhere between 2x and 4x depending on margin, but that range assumes you’re looking at the right ROAS in the first place. MER, which divides total revenue by total ad spend across the entire business, strips out a lot of the platform-level noise and tends to be the number that survives a board meeting.
Pro Tip: Run new-customer ROAS and blended ROAS side by side every week, not just at the end of the month. A widening gap between the two is usually the earliest warning sign that your account is coasting on retargeting instead of growing.
Why Doesn’t Ads Manager ROAS Always Match Your Real Revenue?
Ads Manager is built to make your campaigns look good, not to give you an audited financial statement. View-through conversions and modeled conversions both inflate the ROAS number you see on screen, sometimes substantially.
Arlo’s analysis of Meta attribution points out that on-platform ROAS can run well above what a post-purchase survey or holdout test would confirm, because Meta’s modeling attributes conversions it can’t directly track back to your ads anyway. That’s not fraud, it’s statistical estimation, but it means the number in your dashboard is an estimate dressed up as a fact. Understanding how Meta counts conversions in the first place makes it much easier to spot where that inflation creeps in.
A few checks bring you closer to the truth:
- Reconcile Ads Manager revenue against your Shopify or ecommerce platform revenue weekly. A gap wider than 15% to 20% usually means attribution window mismatch, not measurement error on your platform’s side.
- Run a short post-purchase survey asking “how did you hear about us” and compare the self-reported Meta share against the platform-attributed share.
- Schedule a basic holdout test, geo-based or audience-based, at least once a quarter to measure incremental lift rather than attributed lift.
- Treat MER as your board-level truth number and platform ROAS as your optimization-level diagnostic number. They serve different purposes and shouldn’t be used interchangeably.
Does Advantage+ Outperform Manual Campaign Structures?
Advantage+ Shopping Campaigns have become the default starting point for most ecommerce accounts I look at, and for good reason. The algorithm consolidates learning across audiences faster than a manually segmented account can, which often shows up as a real efficiency edge once the Conversions API and event match quality are properly configured.
That edge isn’t universal. Brands with genuinely distinct customer segments, multiple price tiers, or products that require very different creative angles often still see value in manual campaigns that let them control budget allocation and messaging by segment. Advantage+ works best when your creative library is broad and your tracking is clean. It works worse when you feed it three ads and expect it to find an audience Meta has no signal for.
Comparing ASC and manual performance side by side gets tricky fast, since consolidated campaigns blend cold and warm traffic in ways manual structures don’t. Judge the comparison on new-customer ROAS and blended MER over at least a two-week learning window, not on raw platform ROAS from week one.
How Do You Turn These Benchmarks Into Action?
Benchmarks only earn their keep once you convert them into thresholds that trigger a specific action. Here’s the sequence I walk through with every account.
- Calculate your break-even ROAS. Divide 1 by your contribution margin percentage. A 40% margin product needs a 2.5x ROAS just to break even; a 25% margin product needs 4x. This single number should sit above every dashboard you look at.
- Set concrete triggers, not vague alarms. If ROAS drops below break-even for three consecutive days, pause and diagnose before scaling spend further. If CTR falls 20% below your vertical benchmark for a full week, rotate in new creative rather than waiting it out.
- Build a quarterly validation routine. Audit tracking and attribution setup, refresh your top three creative concepts, and run one incrementality or holdout test every quarter, even when performance looks fine.
Pro Tip: *Write your break-even ROAS on a sticky note on your monitor.
Where Do These Ecommerce Benchmark Numbers Come From?
These figures come from a handful of large-scale 2026 industry reports, cross-checked against each other for consistency.
- Triple Whale’s benchmark report draws on more than 40,000 brands across August 2025 through July 2026, and anchors the headline CPA, CPM, and CVR figures used throughout this piece.
- Flighted’s 2026 report contributes CTR and CPC ranges and flags CPM inflation as an emerging cost pressure.
- Focus Digital’s CTR report supplies placement and objective segmentation for CTR specifically.
- Skale Strategy’s ecommerce-specific breakdown sharpens the vertical-level medians and blended ROAS figures.
Every report defines link CTR, post-click CVR, and attribution windows slightly differently, and sample composition (account size, spend level, season) skews medians in ways no single dataset fully controls for. Treat every number here as a directional benchmark, not a precise target.
How I Use These Benchmarks With Ecommerce Clients
When I open an ad account for the first time, I don’t chase the benchmark number itself. I look at the gap between what the account is doing and what its margin structure actually requires to be profitable.
My rule with clients at Cosma is simple: fix measurement before touching creative, and fix creative before touching bids. Most “bad ROAS” problems I’ve diagnosed turn out to be broken pixels or misread attribution windows, not weak ads. Test your own assumptions before trusting any external number, including the ones in this article.
— Stefano Mazzei
Want Help Applying These Benchmarks to Your Account?
Reading benchmarks is one thing. Knowing whether your account is underperforming its own margin structure, or just underperforming an industry average that doesn’t apply to you, is a different skill entirely, and it’s the first thing my team and I audit on every new account at Cosma. We run measurement audits, structured creative testing, and scaling plans built around your actual break-even ROAS, not a blended median pulled from someone else’s vertical.

An initial consultation generally begins by reviewing your account against relevant benchmarks, assessing tracking accuracy, and identifying key triggers to improve performance quickly. If that sounds like where your account is stuck, you can see how we’ve approached this for other DTC brands in our case studies or go ahead and book a call to walk through your own numbers.
Sources
FAQ
What Is a Good ROAS for Ecommerce on Meta Ads in 2026?
A healthy ROAS typically falls between 2x and 4x depending on your contribution margin, though the blended ecommerce median sits closer to 1.86x. The only number that really matters is your break-even ROAS, calculated by dividing 1 by your margin percentage.
What Is the Average CPA for Meta Ads in Ecommerce?
The overall median CPA across ecommerce accounts is $38.99, with a similar figure of $38.17 reported by Flighted. Vertical matters heavily here, since electronics often runs $45 to $60 while beauty and pets tend to sit closer to $30 to $38.
Why Is My Meta Ads ROAS Different From My Actual Revenue?
Ads Manager ROAS includes view-through and modeled conversions that inflate the number beyond what actually shows up in your bank account. Reconciling weekly against your Shopify or ecommerce platform revenue, and running an occasional holdout test, gives you a more honest picture.
Should I Trust Blended ROAS or New-Customer ROAS More?
New-customer ROAS is the better indicator of whether your acquisition engine is actually working, since blended ROAS includes repeat buyers who were likely to purchase again anyway. Track both, but treat a widening gap between them as a warning sign.
Does Advantage+ Perform Better Than Manual Campaigns for Ecommerce?
Advantage+ Shopping Campaigns often show an efficiency edge in ecommerce accounts once Conversions API and event match quality are configured correctly, largely due to faster algorithmic learning. Manual structures still make sense for brands with distinct customer segments or very different creative needs across product lines.


